Improved ticket heatmap in Insights
timestamp1687510800000
Improvement
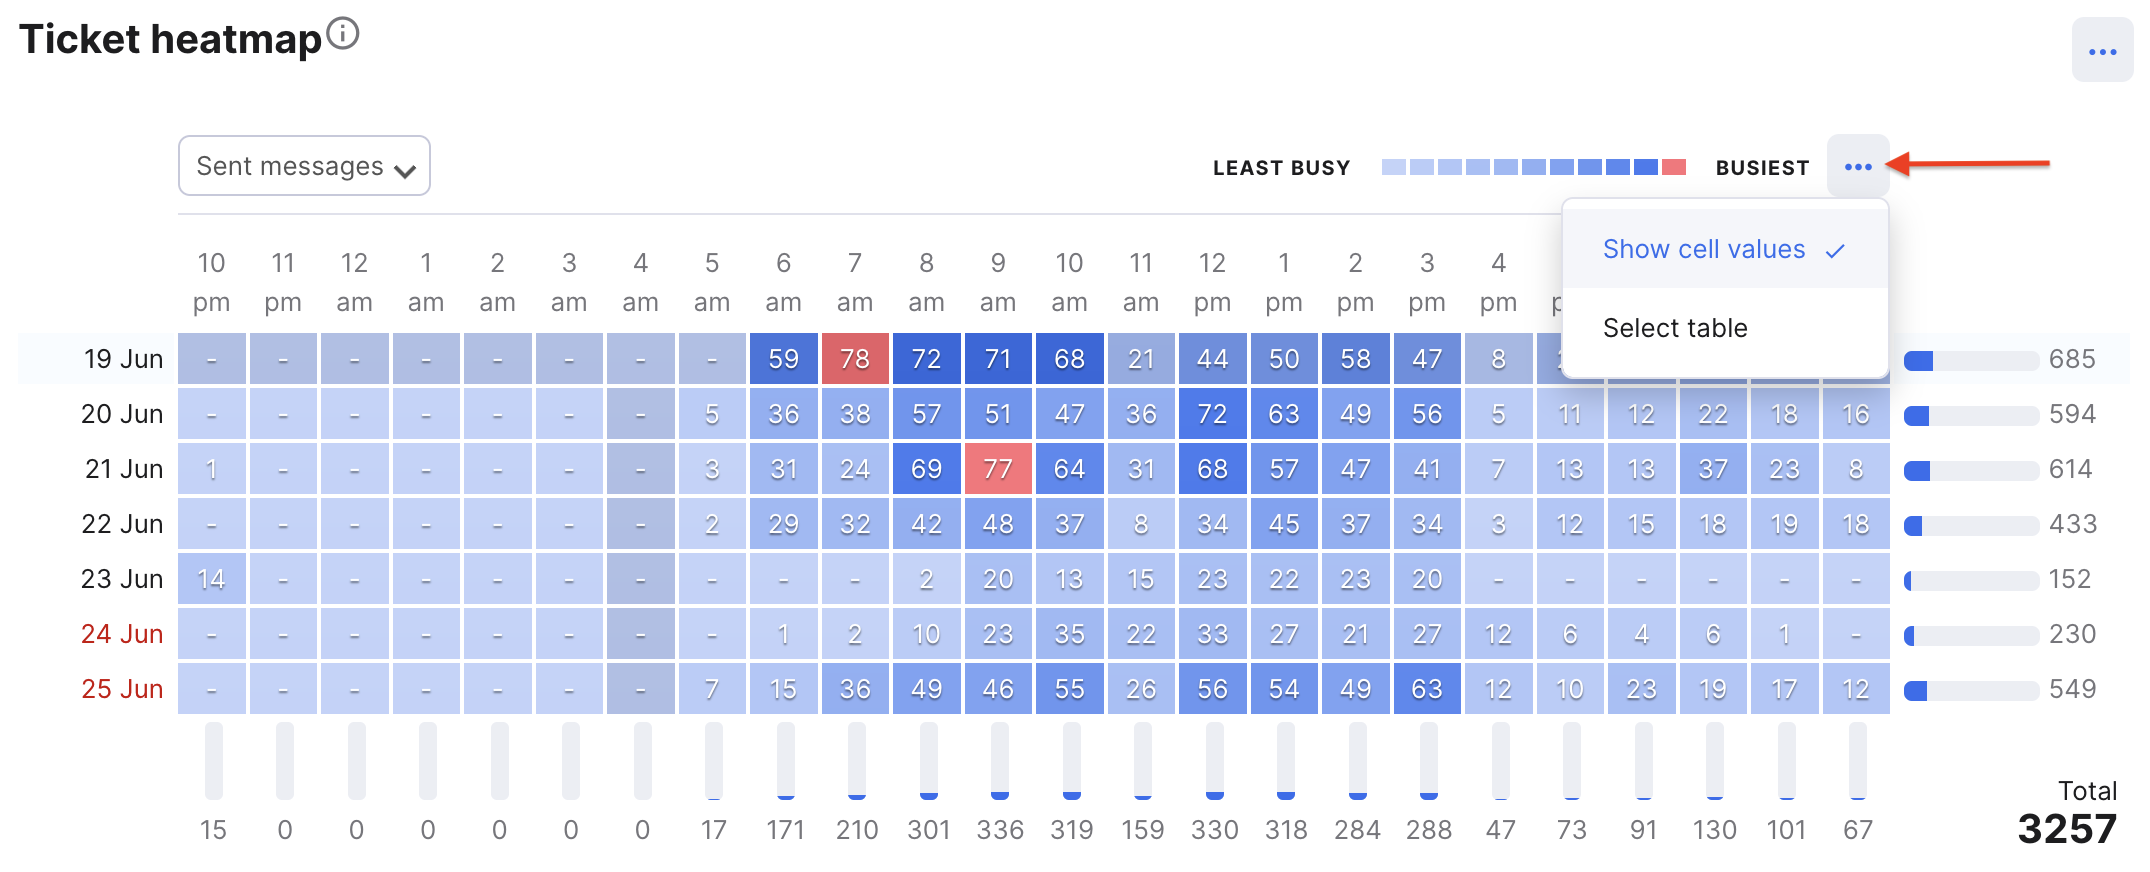
Tired of hovering over each cell to see the values of the cells? We got you!
We’ve added the option to show cell values on all of the cells without having to hover over them, making it MUCH easier to see your team’s performance at a glance!
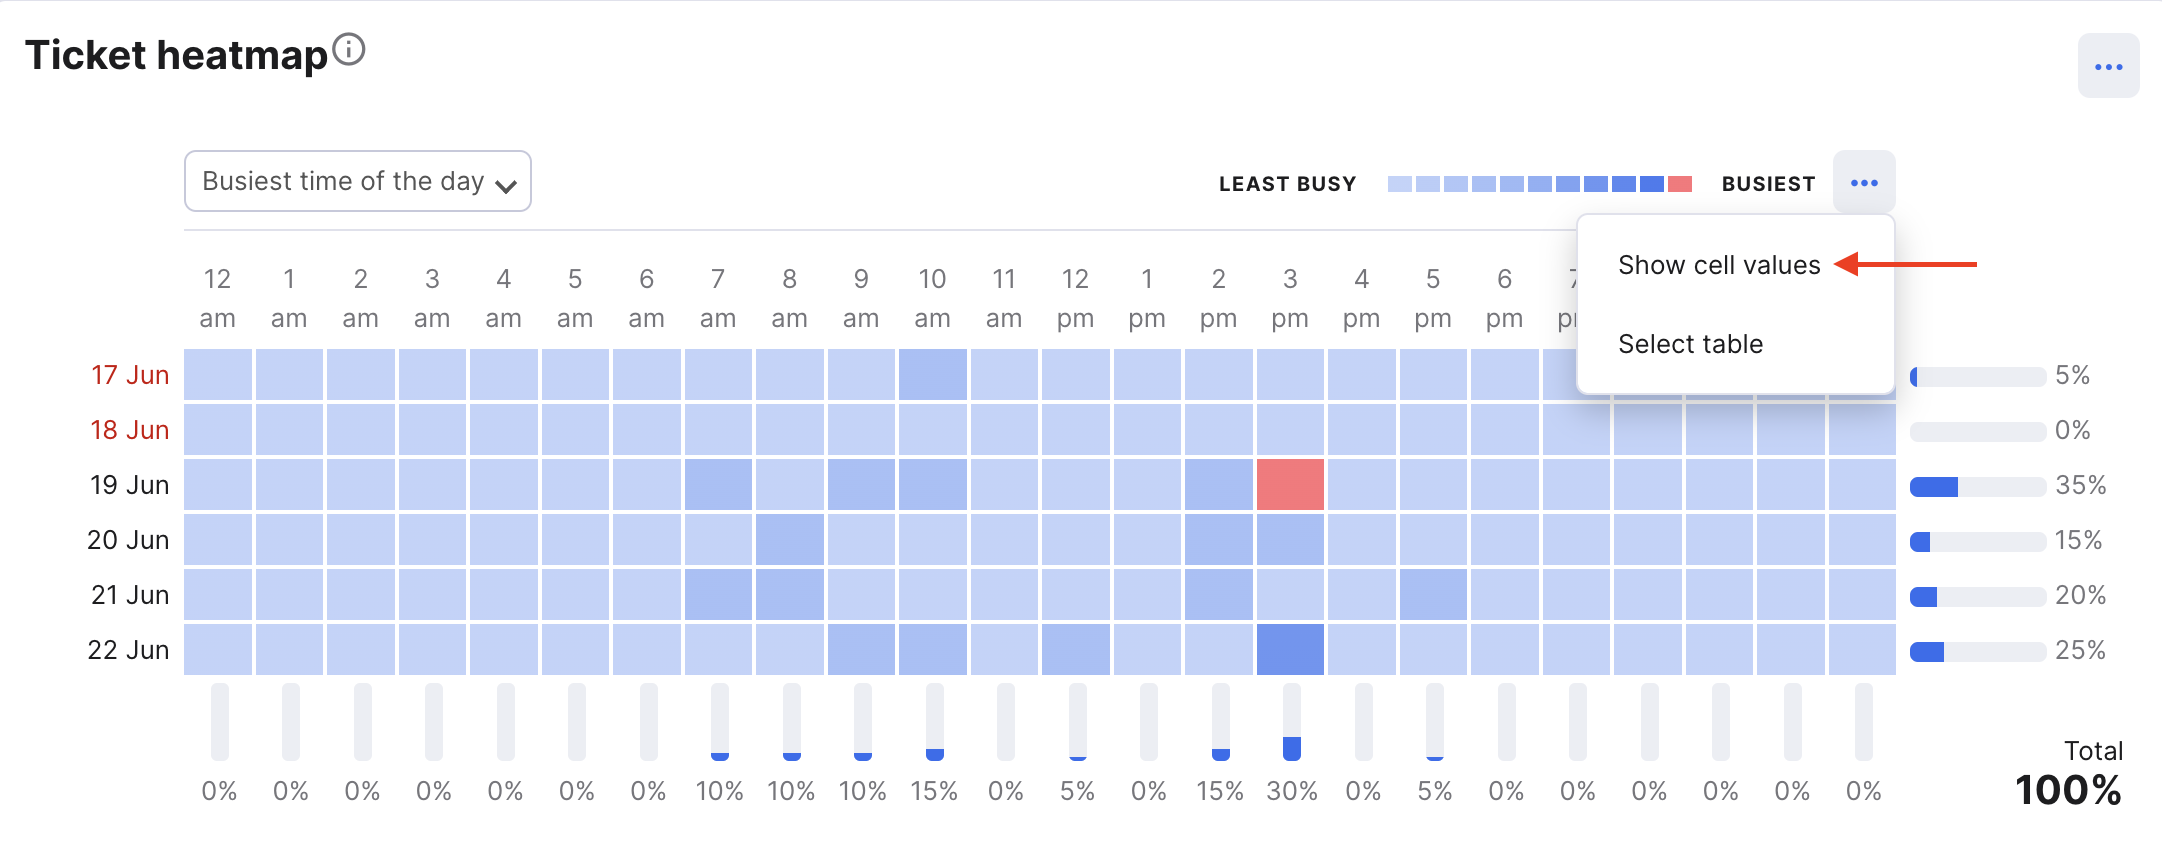

You can also click on Select table to highlight all the values, and then paste them into your sheets for reporting, making it easier to customize reports and drive key improvements.

We hope you find this improvement useful! 🙏🏼
Did you like this update?
![]()
![]()
![]()
Published by Noor Saleh